


What Is JANUS Pro Raw Data? Skin Analysis Data for Cosmetics Research, Skin-Related Studies, and Product Development
How JANUS Pro Raw Data Supports Cosmetic Research and Product Development
When developing cosmetics, what matters is not simply the subjective impression that “the skin seems to have improved.” It is necessary to quantify how the skin changes before and after product use and to compare those changes objectively.
PIE Co., Ltd.’s skin analysis systems are used by cosmetic companies, skin research laboratories, clinical testing institutions, schools, and researchers for product development and efficacy evaluation.
One reason this type of research is possible is that the systems provide not only analysis scores but also various types of Raw Data (original measurement data) generated during the analysis process.
What Raw Data does JANUS Pro provide, and how can these values be used in cosmetic research?
View Research Papers Featuring the JANUS Skin Analysis System
What Is the Difference Between Result Scores and Raw Data?
Typical skin analysis results are presented as scores, grades, or comparisons with age-group averages so that skin conditions are easy to understand. Although convenient for consultation, these results may make it difficult for researchers to examine detailed changes or process and analyze the information using their own algorithms.
Raw Data, by contrast, includes values measured during the actual image-analysis process, such as:
- Total number of pixels in the analysis area
- Number of pixels corresponding to detected skin features
- Converted physical area (mm²)
- Area ratio relative to the analysis area
- Average brightness of the entire skin area and detected area
- Number of detected pores, sebum spots, and other features
- Average pore size
- RGB and Lab values representing skin color
- Length and angle of pore-connection lines
Researchers can therefore examine not only the final score but also which measurement factors changed and by how much before and after product use.
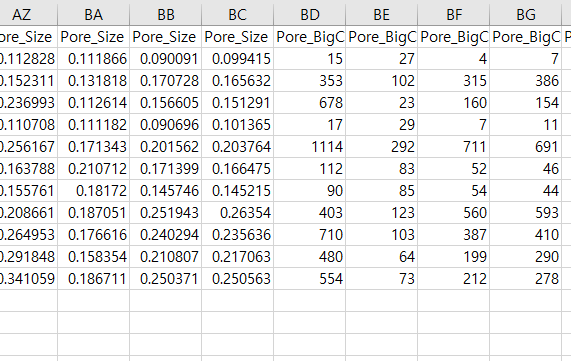
Analysis-Area Data by Facial Region
JANUS Pro does not calculate the entire face as a single value. It divides the face into regions such as the forehead, nose, eye rims, under-eye areas, right and left cheeks, and nasolabial folds.
The representative measurement fields include the forehead, both cheeks, and the nose areas.
The example below shows the forehead area.
- Zone_AllPx Forehead: Total number of pixels in the forehead analysis area
- Zone_AllMm Forehead: Physical area of the forehead analysis region
- Zone_AllPx Right Cheek: Total number of pixels in the right-cheek analysis area
- Zone_AllMm Left Cheek: Physical area of the left-cheek analysis region
These values represent the total skin area used as the reference for each analysis result.
For example, even when the same number of pixels is detected as pigmentation, the proportion of pigmentation on the skin can differ if the total analysis areas are different. Therefore, when comparing results before and after product use, it is important to use JANUS Pro to capture the same region as in the previous measurement.
1. Pore Raw Data
In addition to a pore score, pore analysis provides data on pore area, ratio, brightness, count, and size.
Representative actual fields include:
- Pore_DataPx Forehead: Number of pixels detected as pores
- Pore_DataMm Forehead: Physical area detected as pores
- Pore_AreaRatio Forehead: Proportion of the total analysis area occupied by pores
- Pore_AllBrightnessAvg Forehead: Average brightness of the entire analysis area
- Pore_DataBrightnessAvg Forehead: Average brightness of the area detected as pores
- Pore_Count Forehead: Total number of detected pores
- Pore_Size Forehead: Average size of all detected pores
- Pore_BigCount Forehead: Number of large pores
- Pore_BigSize Forehead: Average size of large pores
- Pore_SmallCount Forehead: Number of small pores
- Pore_SmallSize Forehead: Average size of small pores
These data can be used to evaluate changes before and after the use of pore-care serums, sebum-control products, firming cosmetics, or exfoliating products.
For example, if Pore_AreaRatio decreases after product use, the proportion of the analysis area detected as pores has decreased. If Pore_BigCount and Pore_BigSize also decrease, changes in both the number and average size of large pores can be examined in greater detail.
However, average pore brightness does not indicate the brightness of the skin itself. It should be used to interpret how bright or dark the detected pore regions appear in the image compared with the surrounding skin.
2. Wrinkle Raw Data
Wrinkle analysis provides detected wrinkle area and brightness information by region, including the eye rims, under-eye areas, forehead, and nasolabial folds.
- Wrinkle_DataPx Forehead: Number of pixels detected as wrinkles
- Wrinkle_DataMm Right Eye Rims: Physical area of wrinkles around the right eye
- Wrinkle_AreaRatio Left Under Eye: Wrinkle area ratio beneath the left eye
- Wrinkle_AllBrightnessAvg Right Nasolabial: Average brightness of the right nasolabial analysis area
- Wrinkle_DataBrightnessAvg Left Nasolabial: Average brightness of the detected left nasolabial wrinkle area
Wrinkles are related not only to line length and area but also to the degree of shading visible in an image. When researching wrinkle-improvement products, comparing Wrinkle_AreaRatio with Wrinkle_DataBrightnessAvg can help researchers examine trends in both the detected extent of wrinkles and their visually apparent depth.
These data can be used for before-and-after comparisons of eye creams, anti-aging creams, moisturizers, and products containing ingredients such as retinol or peptides.
3. Elasticity Raw Data
JANUS Pro does not assess elasticity by physically pulling the skin and measuring its recovery. Instead, it uses image analysis to identify age-related visual patterns on the cheeks, such as pores changing from circular to oval shapes or connecting to form fine lines.
Representative fields include:
- EL_AvgLength Right Cheek: Average length of connected pores on the right cheek(mm)
- EL_Count Right Cheek: Number of connected pores on the right cheek
- EL_Angle Left Cheek: Average angle of pore-connection lines on the left cheek
- EL_Top10Length Left Cheek: Average length of the longest top 10% of connection lines on the left cheek
EL_AvgLength, EL_Count, and EL_Top10Length can be used to examine changes in the degree and length of pore connections.
A lower EL_Angle does not automatically indicate better elasticity, nor does a higher angle automatically indicate poorer elasticity. Because the initial direction of pore-connection lines differs among individuals, this value is best used as supplementary data to observe directional changes through repeated measurements of the same person rather than as an absolute elasticity score.
These data can be used to observe long-term changes before and after the use of firming creams, lifting devices, lifting cosmetics, and anti-aging ampoules.
4. Polarized-Light Pigmentation Raw Data
Polarized images reduce reflections from the skin surface and help make visible pigmentation easier to observe.
Representative fields include:
- SpotPL_DataPx Forehead: Number of pixels detected as pigmentation in the polarized image
- SpotPL_DataMm Nose: Physical area of pigmentation on the nose
- SpotPL_AreaRatio Right Cheek: Pigmentation area ratio on the right cheek
- SpotPL_AllBrightnessAvg Left Under Eye: Average brightness of the entire left under-eye analysis area
- SpotPL_DataBrightnessAvg Left Cheek: Average brightness of the pigmentation area on the left cheek
SpotPL_AreaRatio can be used to determine the extent of skin occupied by pigmentation, while SpotPL_DataBrightnessAvg can be used to compare how dark or light the detected pigmentation appears in the image.
In research on functional brightening cosmetics, vitamin C serums, and dark-spot care products, the area and average brightness of pigmentation can be observed together to examine trends in changes in its extent and intensity.
5. UV Pigmentation Raw Data
UV imaging is used to observe pigmentation distribution that may not be clearly visible in normal-light or polarized images.
- SpotUV_DataPx Forehead: Number of pixels detected as UV pigmentation
- SpotUV_DataMm Nose: Physical area of UV pigmentation on the nose
- SpotUV_AreaRatio Right Eye Rims: UV pigmentation area ratio around the right eye
- SpotUV_AllBrightnessAvg Left Cheek: Average brightness of the UV analysis area on the left cheek
- SpotUV_DataBrightnessAvg Right Under Eye: Average brightness of the UV pigmentation area beneath the right eye
UV pigmentation data can be used to observe skin changes related to UV exposure or to compare conditions before and after the use of brightening and sun-care products.
6. Sebum and Porphyrin Raw Data
Under UV light, sebum may appear bright or bluish, while sebum containing porphyrins may appear orange or reddish.
JANUS Pro analyzes these features and provides data including:
- Sebum_NormalCnt Forehead: Number of normal sebum spots on the forehead
- Sebum_NormalCnt Nose: Number of normal sebum spots on the nose
- Sebum_PorphyrinCnt Right Cheek: Porphyrin count on the right cheek
- Sebum_Amount T-Zone: Sebum area in the T-zone
- Sebum_Amount U-Zone: Sebum area in the U-zone
- Porphyrin_Amount T-Zone: Porphyrin area in the T-zone
- Porphyrin_Amount U-Zone: Porphyrin area in the U-zone
These data can be used in research on sebum-control products, cleansers, cosmetics for acne-prone skin, and pore-care products.
It is important to examine the distribution of sebum across the T-zone and U-zone rather than relying only on the total count. The porphyrin ratio may generally be calculated as follows:
Porphyrin count ÷ total sebum count × 100
However, when the total sebum count is very low, a high porphyrin ratio should be interpreted with caution. The ratio should not be assessed alone; the normal sebum count, porphyrin count, and regional distribution should be considered together.
For accurate comparison, conditions such as cleansing status, cosmetic residue, and the waiting time before measurement should also be standardized.
7. Skin-Tone Raw Data
Skin-tone data is generated by calculating average RGB values for each region in a normal-light image and converting them into Lab color coordinates.
- Skintone_RGB_R Forehead: RGB R value of the forehead
- Skintone_RGB_G Nose: RGB G value of the nose
- Skintone_RGB_B Right Under Eye: RGB B value beneath the right eye
- Skintone_LAB_L Left Cheek: Lab L value of the left cheek
- Skintone_LAB_A Right Cheek: Lab a value of the right cheek
- Skintone_LAB_B Forehead: Lab b value of the forehead
Lab values can be understood as follows:
- L value: skin lightness
- a value: color information along the red–green axis
- b value: color information along the yellow–blue axis
In skin-tone research, it is important not only to determine whether the skin has become brighter but also whether differences in brightness among the forehead, nose, under-eye areas, cheeks, and other regions have decreased.
For example, if the mean L value increases after product use while regional differences in L values decrease, this may indicate a trend toward both brighter and more even-looking skin. Analyzing a and b values together also allows changes in redness and yellowness to be compared numerically.
These data can be used in research on brightening products, functional whitening cosmetics, tone-improving products, and soothing products.
How Can Raw Data Be Used in Cosmetic Research?
First, changes before and after product use can be compared quantitatively.
When images are captured under the same conditions before product use and after a defined period, changes in pore area ratio, wrinkle area, pigmentation area, skin tone, and other indicators can be compared numerically.
Second, regional differences in product efficacy can be examined.
Instead of relying only on a whole-face average, researchers can review data for the forehead, nose, eye area, cheeks, and other regions. This makes it possible to analyze differences between the T-zone and U-zone, the right and left sides of the face, or specific areas of concern.
Third, relationships between products and skin data can be studied.
When Raw Data is organized in Excel or statistical software, researchers can analyze how measurement values vary according to factors such as duration of use, product concentration, skin type, and age group.
Possible research designs include:
- Comparison of pore area ratios at weeks 0, 2, 4, and 8
- Comparison of pigmentation changes between a product group and a control group
- Comparison of sebum reduction rates in the T-zone and U-zone
- Analysis of wrinkle and elasticity-indicator changes by age group
- Analysis of skin-tone L values and changes in regional variation
- Analysis of correlations between normal sebum and porphyrin changes
Standardized Imaging Conditions Are Essential for Reliable Comparisons
Even when detailed Raw Data is available, differences in imaging conditions can affect the results.
Therefore, the following conditions should be kept as consistent as possible in research or before-and-after evaluations:
- Whether the subject has cleansed and the waiting time after cleansing
- Whether cosmetics were used before measurement
- Temperature and humidity of the imaging environment
- Time of day
- Facial position and imaging direction
- Product-use period and method of use
In particular, sebum and porphyrins can be affected by cleansing and makeup, while skin tone and redness can vary with temperature, exercise, alcohol consumption, and external irritation.
The availability of Raw Data alone does not automatically make research results objective. The value of comparisons improves only when the same system, same imaging environment, same pre-measurement conditions, and same analysis criteria are maintained.
Evaluate Skin Through Data, Not Scores Alone
JANUS Pro provides easy-to-understand analysis scores while also supplying Raw Data for more in-depth research.
Pores, wrinkles, elasticity indicators, polarized-light pigmentation, UV pigmentation, sebum, porphyrins, and skin tone can be evaluated through pixel counts, physical areas, area ratios, average brightness, detection counts, average sizes, and RGB and Lab values.
This enables cosmetic companies and researchers to compare detailed changes before and after product use and select indicators suited to their research objectives for statistical analysis or product-recommendation systems.
PIE Co., Ltd.’s skin analysis systems are used by cosmetic companies, skin research laboratories, and other research settings because they do more than capture skin images: they convert changes identified in skin images into numerical data that can be used for research.
※ JANUS Pro image-analysis data is intended for observing and comparing skin conditions. When using the data for official cosmetic efficacy substantiation, clinical studies, or academic papers, an appropriate study design, standardized imaging conditions, statistical analysis, and relevant evaluation criteria must also be applied.